
Analytics
An overview of the metrics within the analytics page of Question Stream.
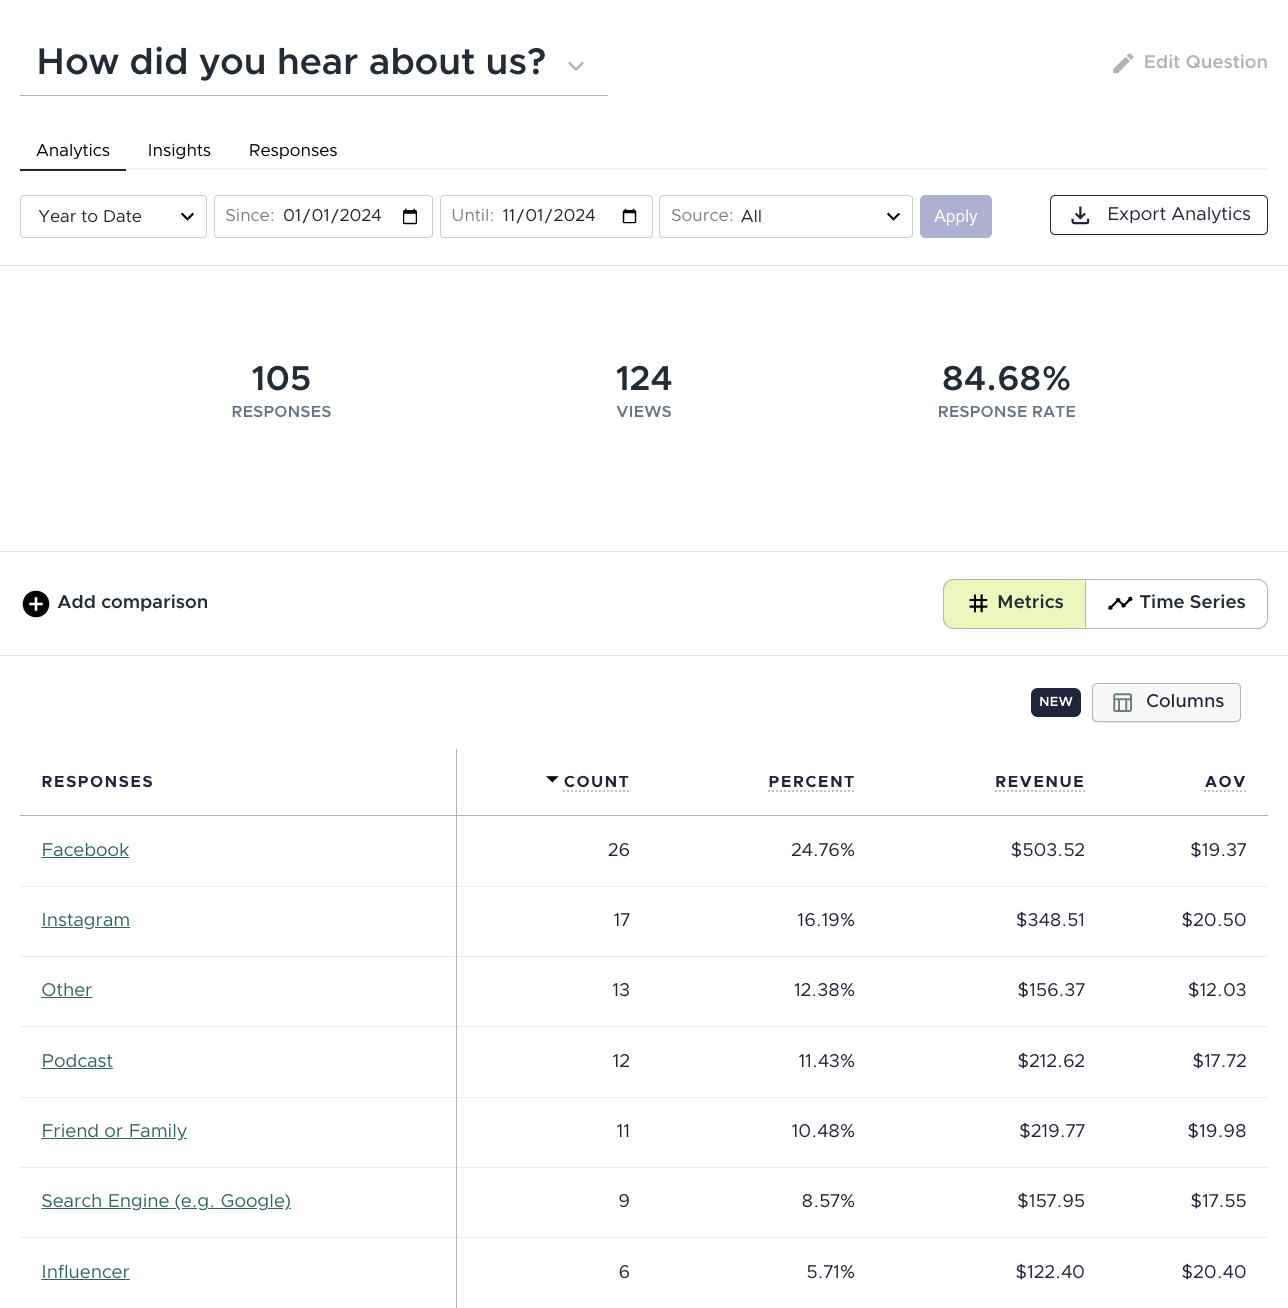
Analytics
Responses
The responses number represents the total of all of the responses received for the question where the order was placed in the specificied date range. The date range filters on the order created at date.
Views
When our scripts load, we will count it as a view. However, a view will only count once per question, which means if a customer keeps going back to the confirmation page via a link in the order or shipping confirmation email, it will not keeping counting views for the question that is being presented.
Response Rate
Response rate is Responses/Views*100 for the specified date range.
Count
The "Count" column shows the count of responses that specific response received.
Percent
The "Percent" column shows the percentage of responses that specific response received out of the total responses received.
Revenue
The "Revenue" column shows the total amount in the shop's currency related to the specific response. We take the order total of each purchase that corresponds to a specific response, and find the sum in the shop's currency.
AOV
The "AOV" (Average Order Value) column shows the average order total for each response (Revenue/Count).
Extrapolated Count
Extrapolation estimates total values by extending observed response data. In Analytics, you can extrapolate Response Count to 100% by enabling the Extrapolated Count column in the Columns dropdown.
Extrapolated Count = (Count/Response Rate) x 100
Extrapolated data assumes respondents are representative of your full customer base; to reduce potential non-response bias, we recommend aiming for a question completion rate above 35%.
Extrapolated Revenue
Extrapolation estimates total values by extending observed response data. In Analytics, you can extrapolate Response Revenue to 100% by enabling the Extrapolated Revenue column in the Columns dropdown.
Extrapolated Revenue = (Revenue/Response Rate) x 100
Extrapolated data assumes respondents are representative of your full customer base; to reduce potential non-response bias, we recommend aiming for a response rate above 35%.
Original & Delta
Updated 7 months ago