
Lifetime Value Analytics
Identify responses that drive higher customer retention, analyzed by cohort.
Fairing's Lifetime Value (LTV) Analytics report is included on all plans and is currently only available to Shopify merchants.
How we get the data
Once you have signed up for LTV, we will pull all historical order data for your shop from Shopify so that we can accurately compute LTV. We will continually listen for any updates to past orders so that partial refunds, full refunds, cancelled orders etc. are reflected in the order data we have on our end and factored into the LTV calculation.
LTV Analytics
The date filters at the top of the report filter all 3 available reports. The start month/year chosen will represent the cohort data is shown for in the first 2 tables. For example, if January 2024 is selected as the start time period, the first 2 tables will display data for all customers who placed their first order in January 2024. The end month/year chosen will represent what time period subsequent orders are counted until. For example, if May 2024 is selected as the end time period, only orders placed through May 2024 will be included in the data/metrics shown. Any orders placed past the end time period will not be included in the data/metrics shown.
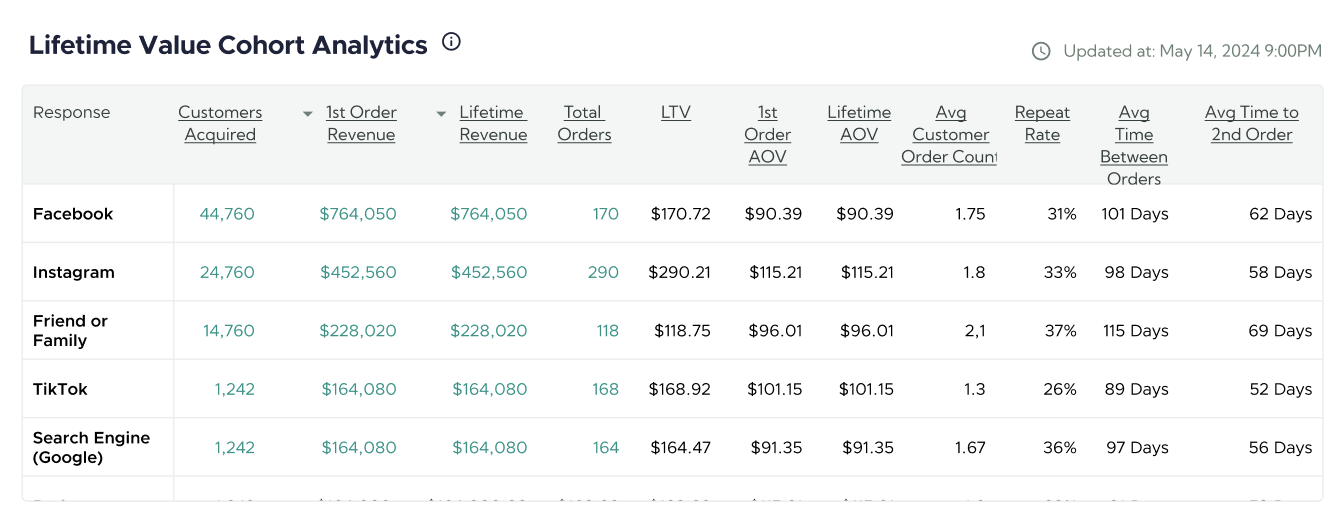
Lifetime Value Cohort Analytics
The Lifetime Value Cohort Analytics table displays an overview of customers who made their first order during the selected start month. Only the first response provided by the customer is shown. The following columns are displayed in the table:
Response
Any response present on your question during the selected start month.
Customers Acquired
Number of customers acquired that made their first order during the selected start month. Only the first response provided by the customer is shown.
1st Order Revenue
Revenue from the selected cohort's first order. Shipping & taxes are not included.
Lifetime Revenue
Revenue from all orders made by the cohort within the selected time period. Shipping & taxes are not included.
Total Orders
Total number of orders made by the cohort within the selected time period.
LTV
Lifetime Value = Lifetime Revenue / Customers Acquired.
1st Order AOV
Average order value for the cohort's first order only.
Lifetime AOV
Average order value for all orders made by the cohort within the selected time period.
Average Customer Order Count
Average Customer Order Count = Total Orders / Customers Acquired.
Repeat Rate
Percent of customers who have made at least 2 orders within the selected time period.
Avg Time Btwn Orders
Average time in days between all orders made by the cohort within the selected time period.
Avg Time Btwn 1st & 2nd Order
Average time in days between the 1st and 2nd order within the selected time period.
Lifetime Value Cohort Comparison
The Lifetime Value Cohort Comparison table compares LTV by response for customers who made their first order during the selected start month. Only the first response provided by the customer is shown. A heatmap is applied to the Cumulative LTV values, with the lowest value displaying as white and the highest value displaying as a dark green. The following columns are displayed in the table:
Response
Any response present on your question during the selected start month.
Customers Acquired
Number of customers acquired that provided a given response on their first order.
1st Order AOV
Average order value for the cohort's first order only.
Cumulative LTV
Sum of all the revenue a cohort has generated up until the given month divided by the customers acquired for that cohort.
Lifetime Value Cohorts by Individual Response
The Lifetime Value Cohort by Individual Response table compares LTV by month acquired for a single response from customers who made their first order in a given month. The response viewed is controlled by the drop down selector below the table header. A heatmap is applied to the Cumulative LTV values, with the lowest value displaying as white and the highest value displaying as a dark green. The following columns are displayed in the table:
Month Acquired
The month the cohort placed their first order in.
Customers Acquired
Number of customers acquired that provided a given response on their first order.
1st Order AOV
Average order value for the cohort's first order only.
Cumulative LTV
Sum of all the revenue a cohort has generated up until the given month divided by the customers acquired for that cohort.
M0
The month the cohort placed their first order in. For example, if Month Acquired is January 2024, M0 is also January 2024.
Updated 8 months ago